Periodicity of multiples
 | |
| Series | Investigations in Geophysics |
|---|---|
| Author | Öz Yilmaz |
| DOI | http://dx.doi.org/10.1190/1.9781560801580 |
| ISBN | ISBN 978-1-56080-094-1 |
| Store | SEG Online Store |
When periodicity is preserved adequately, predictive deconvolution can be used to predict and attenuate multiples either in CMP or in the τ − p domain. For instance, short-period multiples and reverberations are largely attenuated by the application of predictive deconvolution to prestack data. Figure 6.1-1 shows selected CMP gathers along a marine line with the accompanying amplitude spectra and their autocorrelograms averaged over the traces of each gather. Note the abundance of guided waves in the postcritical region (approximately between 0-0.5 s at near offset and 0-4 s at far offset), and short-period multiples and reverberations in the subcritical region (below 0.5 s at near offset and below 4 s at far offset). (See Section F.1 for modeling guided waves.) The peaks of the amplitude spectra are associated with the short-period multiples. The smaller the period of the multiples, the larger the separation of the peaks in the amplitude spectrum. The refracted arrival and its multiples as part of the guided wave energy indicate that the line has been recorded over a hard water-bottom area. Following t-squared scaling for geometric spreading correction and muting guided waves (Figure 6.1-2), the periodicity character of the multiples becomes more distinctive, particularly at near offsets. With the application of predictive deconvolution using unit-prediction lag (Figure 6.1-3), the amplitude spectrum is flattened within the passband, and multiples are greatly attenuated. The multiple attenuation also is indicated by the autocorrelograms of the deconvolved gathers in Figure 6.1-3.
-
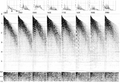 Figure 6.1-1 Selected CMP gathers without geometric spreading correction. Average amplitude spectrum and autocorrelogram for each gather are shown on top and bottom, respectively.
 -
 Figure 6.1-2 Same gathers as in Figure 6.1-1 after t-squared scaling for geometric spreading correction and muting guided waves.
 -
 Figure 6.1-3 Same gathers as in Figure 6.1-2 after predictive deconvolution.
 -
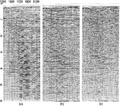 Figure 6.1-4 (a) CMP stack associated with the gathers shown in Figure 6.1-2 without prestack deconvolution; (b) CMP stack associated with the gathers shown in Figure 6.1-3 with deconvolution before stack; (c) CMP stack as in (b) with the additional deconvolution after stack.


Figure 6.1-4a shows the CMP stack associated with the gathers in Figure 6.1-2 without multiple attenuation, and Figure 6.1-4b shows the CMP stack associated with the gathers in Figure 6.1-3 with multiple attenuation using deconvolution. Compare these two stacked sections and note that deconvolution before stack has attenuated much of the short-period multiples. Additional deconvolution after stack further improves the vertical resolution by restoring the flatness of the spectrum within the passband (Figure 6.1-4c).
Figure 6.1-5 shows a CMP gather with and without deconvolution. Aside from water-bottom multiples, note the peg-leg multiples associated with the two primaries with arrival times of 1.5 and 2 s at near offset. The autocorrelogram clearly exhibits periodicity of the multiples especially at near offsets. Following predictive deconvolution (in this case with a unit-prediction lag), multiples are largely attenuated as seen in Figure 6.1-4b. The corresponding autocorrelogram is void of the energy associated with the reverberations and multiples. High-frequency random noise that has been boosted by the whitening effect of spiking deconvolution can be filtered out.
Figures 6.1-6 and 6.1-7 clearly demonstrate that conventional statistical deconvolution is a powerful method for attenuating not just short-period multiples and reverberations, but also moderately long-period multiples based on the periodicity criterion. The data shown in Figure 6.1-6 contain nearly flat primary reflections, while the data in Figure 6.1-7 contain some dipping primary reflections. The water-bottom multiples in both figures arrive at intervals of approximately 350 ms. There also exist peg-leg multiples associated with the primaries at approximately 1.5 and 2.5 s in Figure 6.1-6, and the primaries at approximately 1.5 and 2.1 s in Figure 6.1-7. In a conventional processing sequence, prestack and poststack deconvolution combined with CMP stacking, which exploits velocity discrimination between primaries and long-period multiples, can significantly attenuate a large class of multiples.
-
 Figure 6.1-5 A field record containing short-period reverberations before (a) and after deconvolution (b). The solid lines represent the start and end times for the autocorrelation estimation windows.
 -
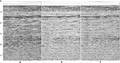 Figure 6.1-6 A portion of a CMP stack (a) without deconvolution, (b) with prestack deconvolution, and (c) with pre- and poststack deconvolution. (Data courtesy Total Norway.)
 -
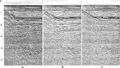 Figure 6.1-7 A portion of a CMP stack (a) without deconvolution, (b) with prestack deconvolution, and (c) with pre- and poststack deconvolution. (Data courtesy Total Norway.)


See also
- Velocity discrimination between primaries and multiples
- Karhunen-loeve transform
- Modeling of multiples
External links
| find literature about Periodicity of multiples |

|

|

|

|

|

|

|