2-D poststack depth migration
 | |
| Series | Investigations in Geophysics |
|---|---|
| Author | Öz Yilmaz |
| DOI | http://dx.doi.org/10.1190/1.9781560801580 |
| ISBN | ISBN 978-1-56080-094-1 |
| Store | SEG Online Store |
Figure 8.2-1 shows a velocity-depth model for a salt pillow. The aspect ratio of the horizontal and vertical axes is 1; hence, the diagram exhibits the true shape of the diapiric structure. The model can be treated in three parts — the constant-velocity overburden above the salt, the salt diapir itself, and the substratum that includes the flat reflector below. So far as the flat reflector is concerned, the salt diapir constitutes a complex overburden structure with strong lateral velocity variations. Note the significant velocity contrast across the top-salt boundary and the undulating reflector geometry of the base-salt boundary — both give rise to ray bending that can only be handled by imaging in depth.
A total of 154 shot records were modeled along the lateral extent of the velocity-depth model in Figure 8.2-1 using the two-way acoustic wave equation. Shot and receiver group intervals both are 50 m, and the trace spacings of the CMP-stacked and zero-offset sections are 25 and 50 m, respectively. In Figure 8.2-1, the velocity-depth model, the CMP-stacked and zero-offset sections have been displayed with the correct lateral position with respect to one another. Note the focusing and de-focusing of the reflection amplitudes associated with the base-salt boundary on the zero-offset and CMP-stacked sections.
Selected shot records are shown in Figure 8.2-2. Each shot record consists of 97 channels associated with a split-spread geometry. The shot interval is 50 m and the receiver group interval is 50 m. The maximum offset is 2350 m. Note the complexity of reflection times on shot records located over the salt diapir and the variations in reflection amplitudes caused by the focusing and defocusing of rays.
The complexity of reflection traveltimes surprisingly is not as apparent on the CMP gathers (Figure 8.2-3) as it is on the shot records (Figure 8.2-2), although variations in reflection amplitudes can be observed with ease. CMP stacking, however, clearly shows the effect of nonhyperbolic moveout (Figure 8.2-1). Compare with the zero-offset section and note the traveltime and amplitude distortions on the CMP-stacked section. Departure of the stacked section from the true zero-offset section imposes a limitation on the accuracy of the image we get from poststack depth migration.
We now closely examine the degree of ray bending at layer boundaries in the salt diapir model. Shown in Figure 8.2-4 are the normal-incidence rays from each of the three layer boundaries — top-salt, base-salt and the flat reflector below, and the computed zero-offset traveltimes. Superposition of the modeled traveltime trajectories yields the zero-offset traveltime section associated with the velocity-depth model as shown in Figure 8.2-4. The zero-offset section in Figure 8.2-1 represents a modeled zero-offset wavefield, whereas the zero-offset section in Figure 8.2-4 represents a modeled zero-offset traveltime profile.
-
 Figure 8.2-1 (Top) An earth model in depth with a salt diapir; (middle) CMP-stacked section derived from the modeled prestack data in Figure 8.2-3; (bottom) the modeled zero-offset section. The stacked and zero-offset sections are appropriately aligned in the lateral direction with respect to the earth model above. Trace spacings in the stacked and zero-offset sections are 25 m and 50 m, respectively. No amplitude scaling has been applied to the sections. The aspect ratio of the horizontal and vertical axes in the velocity-depth model is 1.
 -
 Figure 8.2-2 A selection of modeled common-shot gathers associated with the earth model in Figure 8.2-1. Numbers on top represent the nearest CMP location. No amplitude scaling has been applied to the data.
 -
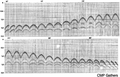 Figure 8.2-3 A selection of CMP gathers derived from sorting of the modeled common-shot gathers as in Figure 8.2-2. Numbers on top represent the CMP location. No amplitude scaling has been applied to the data.
 -
 Figure 8.2-4 (Left column) Velocity-depth model as in Figure 8.2-1 with normal-incidence rays from each of the layer boundaries; (right column) corresponding zero-offset traveltimes. The bottom-right frame shows the superposition of the zero-offset traveltimes associated with the three layer boundaries. The vertical axis in the traveltime sections is two-way zero-offset time.


See also
- Image rays and lateral velocity variations
- Time versus depth migration
- Iterative depth migration
- Iteration with zero-offset data
- Iteration with CMP-stacked data
- Iteration with prestack data
- Iteration in practice
External links
| find literature about 2-D poststack depth migration |