Removal of opacity
 | |
| Series | Investigations in Geophysics |
|---|---|
| Author | Öz Yilmaz |
| DOI | http://dx.doi.org/10.1190/1.9781560801580 |
| ISBN | ISBN 978-1-56080-094-1 |
| Store | SEG Online Store |
Figure 7.5-7a shows a horizontal slab of about 100 ms in thickness isolated from a 3-D poststack time-migrated volume of data. The amplitudes within the slab were actually manipulated to enhance the structural and de-positional features. Amplitude manipulation involves suppressing a range of positive and negative amplitudes below a specified threshold value so as to remove the opacity effect caused by the suppressed amplitudes. The same slab with labeled depositional features is shown in Figure 7.5-7b. Among the features identified are a carbonate shelf, the shelf edge, a channel system, and two submarine fan lobes. The color indicates the seismic amplitudes retained in the slab. Figure 7.5-7b is a product of what interpretive work means — a description of the depositional environment.
To demonstrate that interpretation is not just picking a set of time horizons, but it is more what you do after picking, consider the data set in Figure 7.5-8. We see a sample time slice (Figure 7.5-8a), a crossline (Figure 7.5-8b) and an inline (Figure 7.5-8c). The objective is to identify sand dunes which are confined between horizons T6 and T8. None of the conventional displays in the form of cross-sections of the image volume as shown in Figure 7.5-8 can provide a rapid identification of the sand dunes.
Start with the entire image volume and isolate a time slab bounded by the time horizons T6 and T8 as labeled in Figures 7.5-8b,c. Then, remove opacity to enhance the series of sand dunes as shown in Figure 7.5-9a. A vertical cross-section of the slab with the individual sand dunes is shown in Figure 7.5-9b.
An interpretation of a deltaic sequence is made possible by 3-D visualization and amplitude manipulation. Figure 7.5-10a shows the sequence under consideration highlighted on a vertical cross-section from a time-migrated volume of data. Figure 7.5-10b shows the isolated deltaic sequence with the individual members of the sequence identified by removing opacity from the subvolume that includes the deltaic sequence highlighted in Figure 7.5-10a.
-
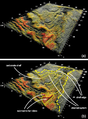 Figure 7.5-7 Identification of depositional environment. See text for details. (Interpretation by Gerald Kidd; courtesy Paradigm Geophysical.)
 -
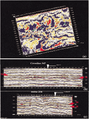 Figure 7.5-8 (a) A time slice, (b) a crossline, and (c) an inline from a 3-D volume of time-migrated data. (Interpretation by Elaine Hong; courtesy Paradigm Geophysical.)
 -
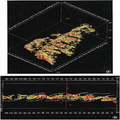 Figure 7.5-9 Delineation of sand dunes using the opacity removal technique. See text for details. (Interpretation by Elaine Hong; courtesy Paradigm Geophysical.)
 -
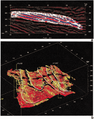 Figure 7.5-10 (a) A depositional sequence associated with a deltaic deposition highlighted on a vertical cross-section from a 3-D time-migrated volume of data, (b) the same depositional sequence as in (a) in 3-D perspective with opacity removed. See text for details. (Interpretation by Elaine Hong; courtesy Paradigm Geophysical.)


See also
- Interpretation of 3-D seismic data
- Time slices
- 3-D visualization
- Seed detection
- Structural interpretation
- Stratigraphic interpretation
External links
| find literature about Removal of opacity |