File:Fig4klmML.JPG
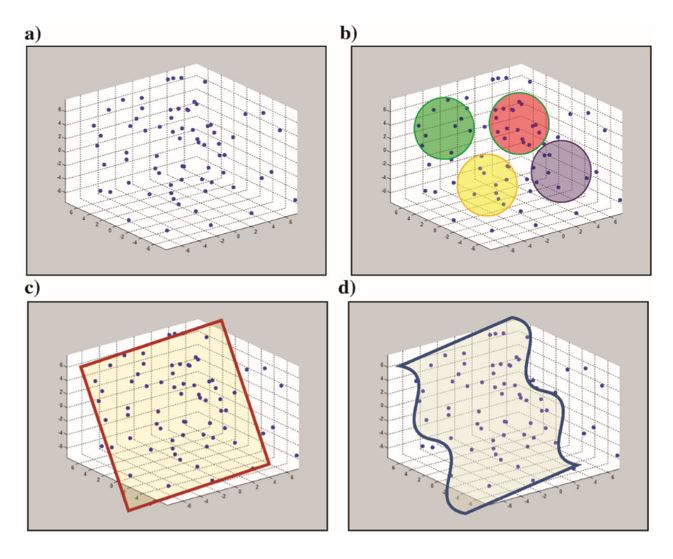
Fig4klmML.JPG (673 × 559 pixels, file size: 67 KB, MIME type: image/jpeg)
Summary
Figure 4. (a) A distribution of data points in 3D attribute space. The statistics of this distribution can be defined by the covariance matrix. (b) k-means will cluster data into a userdefined number of distributions (four in this example) based on the Mahalanobis distance measure. (c) The plane that best fits these data is defined by the first two eigenvectors of the covariance matrix. The projection of the 3D data onto this plane provides the first two principal components of the data, as well as the initial model for our SOM and GTM algorithms. (d) SOM and GTM deform the initial 2D plane into a 2D manifold that better fits the data. Each point on the deformed 2D manifold is in turn mapped to a 2D rectangular latent space. Clusters are color coded or interactively defined on this latent space (Zhao et al 2015)
File history
Click on a date/time to view the file as it appeared at that time.
| Date/Time | Thumbnail | Dimensions | User | Comment | |
|---|---|---|---|---|---|
| current | 12:23, 16 October 2019 | | 673 × 559 (67 KB) | Karelialm (talk | contribs) | Figure 4. (a) A distribution of data points in 3D attribute space. The statistics of this distribution can be defined by the covariance matrix. (b) k-means will cluster data into a userdefined number of distributions (four in this example) based on the Ma |
You cannot overwrite this file.
File usage
The following page uses this file: